Plasma Modeling: Ablation/Deposition in Arc Discharge
Self-Consistent Plasma Modeling of the Carbon Arc
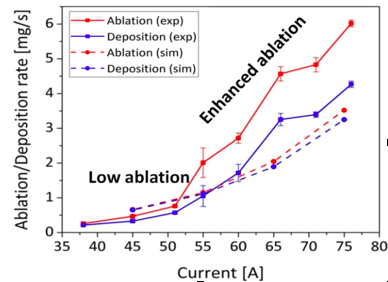
Figure 1. Rates of anode material ablation and carbon deposition at the cathode as functions of arc current; comparison of simulation results and experimental data.
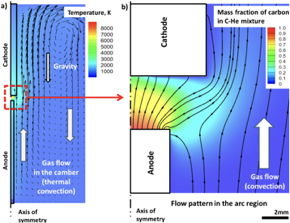
Figure 2. Flow pattern and temperature profile in the reaction chamber (a) and carbon gas mass fraction profile in the arcing volume (b).
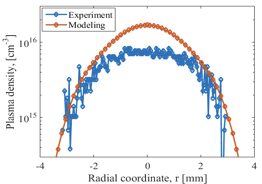
Figure 3. Rates of anode material ablation and carbon deposition at the cathode as functions of arc current; comparison of simulation results and experimental data.
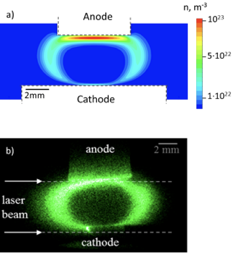
Figure 4. Density profile of C2 molecules: results of the simulations (a) and experimental C2 emission pattern obtained using planar LIF.
Previous Work
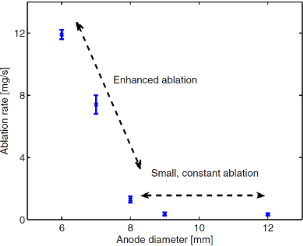
Figure 5. Anode material ablation rate as a function of anode diameter.

Figure 6. Schematic of inter-electrode plasma. Region I is the nearanode region and arc column. Region II is the near-cathode region with trapped ions.
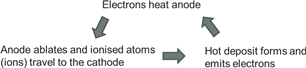
Figure 7. Schematics of particles' circulationin the near-cathode region .