Optical Emission Spectroscopy (OES)
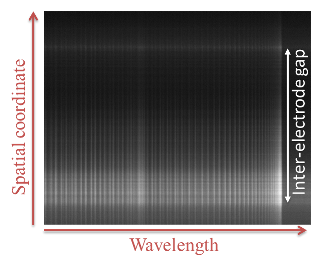
Figure 1: Spectral image of the C2 Swan band part collected during the arc-based nanomaterial synthesis
The role of catalyst (mostly metals, for instance Ni, Co, etc) in synthesis of various nano-structures can be also studied by OES through observation of its isolated atomic spectral lines. Ussualy, local density distributions of catalist can be obtained via comparison of spectral line intensities. Similarly, spectral lines of buffer/carrier gases (like He, Ar, N, CH4) can be used for estimation of the gas temperature and density profiles and evolution during the nanomaterial synthesis.
The role of plasma in nano-material synthesis, in spite of broad application and research, is still unrevealed to scientific community. Such a lack of information about the plasma (arc discharge, in particular) itself which forms an environment for nano-material synthesis inhibits the development and progress of nanotechology. The necessity in knowledge of arc discharge parameters and ability to control them forces deeper investigation of atmospheric arc plasma. Since arc plasma channel is connected to electrodes by means of sheaths, where an interaction of plasma with specific material (carbon, boron, metal catalysts, etc) occurs, their identification and characterization is also of great interest of current research. Therefore, ions, neutrals and electrons are in a focus of OES diagnostic built at Princeton Laboratory for Plasma Nanosynthesis at PPPL.
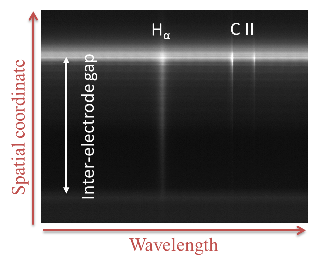
Figure 2: Spectral image of the arc gap with spectral lines of Hydrogen atoms and Carbon ions collected during the arc-based nanomaterial synthesis. Continium radiation from the electrodes are seen as a bright horizontal lines
Implementation of OES diagnostic for arc discharge study meets specific observational challenges related to geometry limitations (small and varying inter-electrode gap), strong background thermal radiation and affluence of soot on optical elements that finally results in a little knowledge today about the arc plasma distribution and evolution during the synthesis. The use of state of the art hardware (spectrographs, imaging sensors, including intensified and gated, photomultiplier tubes, etc) and software (Labview, Matlab, etc) is beneficial to overcome many obstacles and reveal the complete picture of plasma arc density, temperature and its component distribution and evolution during the nanomaterial synthesis. Several techniques and methods are utilized for spectra analysis, including but not limited to a) Bolzmann diagram plotting to reveal electron temperature, b) comparision of spectral line ratios vs. thermodynamic state of the plasma or collisional radiative modeling for temperature and density calculations (the latter requires absolute calibration of OES diagnostic), c) analysis of spectral line shape to derive the temperature and density (see Figure 2, where spectral lines of Hydrogen and Carbon ions are seen). Since OES is an integral technique, i.e., accounts for the entire plasma volume along line of view, optical depth effects and plasma non-uniformity in distribution is accounted as well.
As plasma radiation represents physical conditions and state of plasmas, the accurate and systematic analysis helps us to understand the synergetic role of the plasma in nanomaterial synthesis and underlying physical mechanisms.